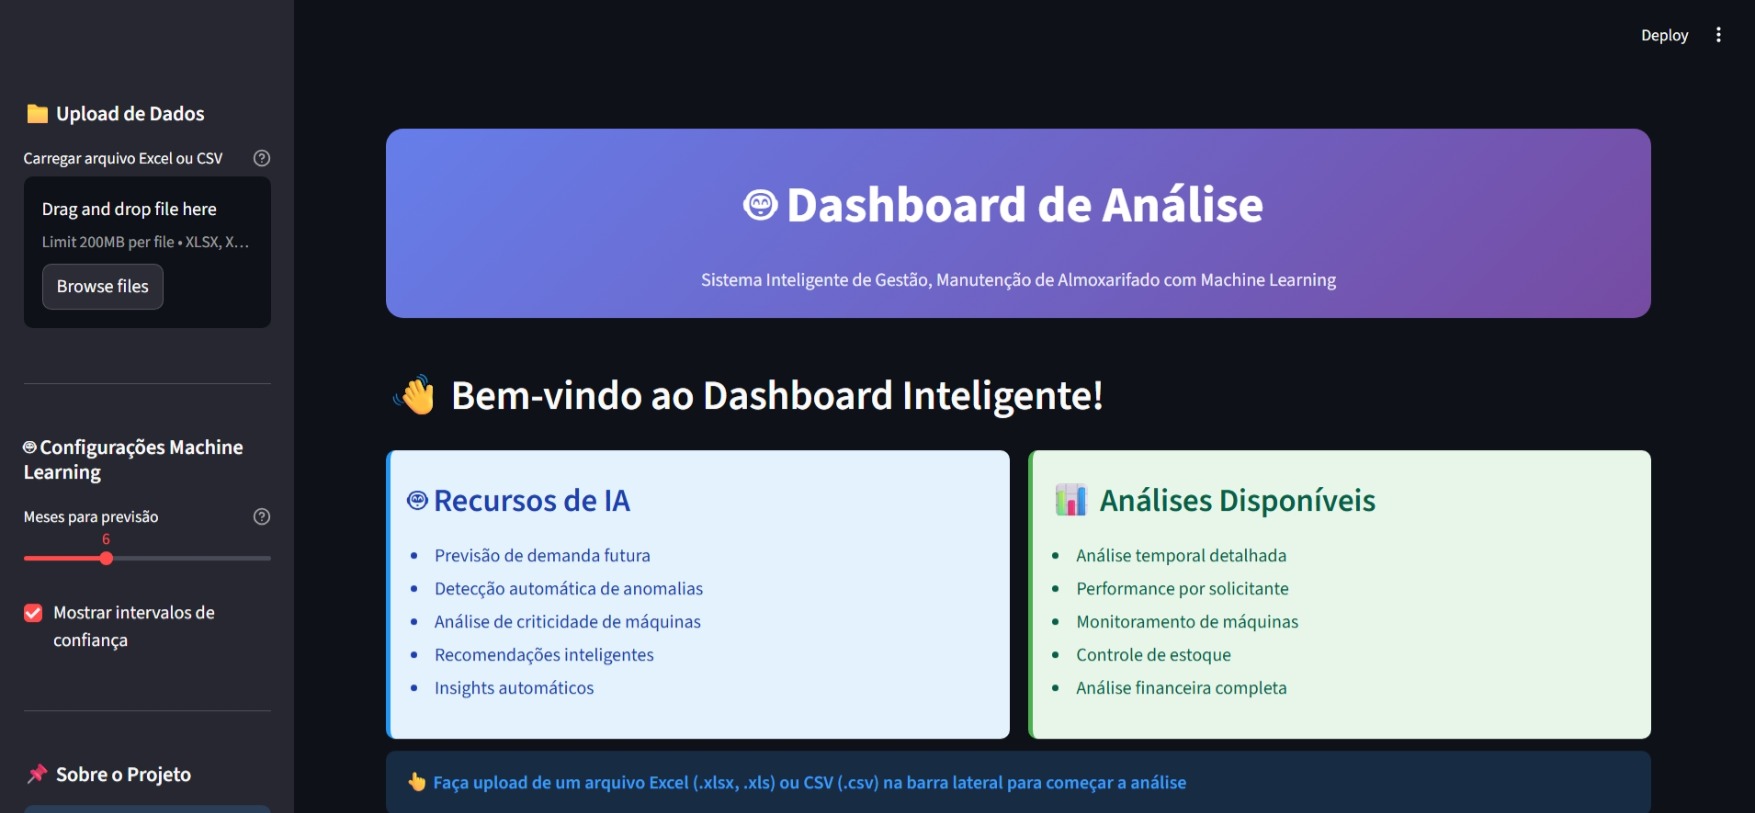
Warehouse Dashboard with Machine Learning
Intelligent system developed for predictive analysis and strategic management of industrial warehouses.
Uses advanced Machine Learning techniques to predict demands, detect anomalies,
and optimize maintenance processes. The dashboard offers an interactive interface with
Streamlit, supporting Excel and CSV files.
- Tools: Python, Streamlit, Scikit-learn, Prophet, Plotly, Pandas
- ML Models: Linear Regression, Random Forest, Gradient Boosting, Prophet (Meta)
- Features: 3-12 months forecasts, anomaly detection, criticality analysis, financial control
- Highlight: NumPy 2.0+ patch, automatic data validation, chronologically ordered interactive charts
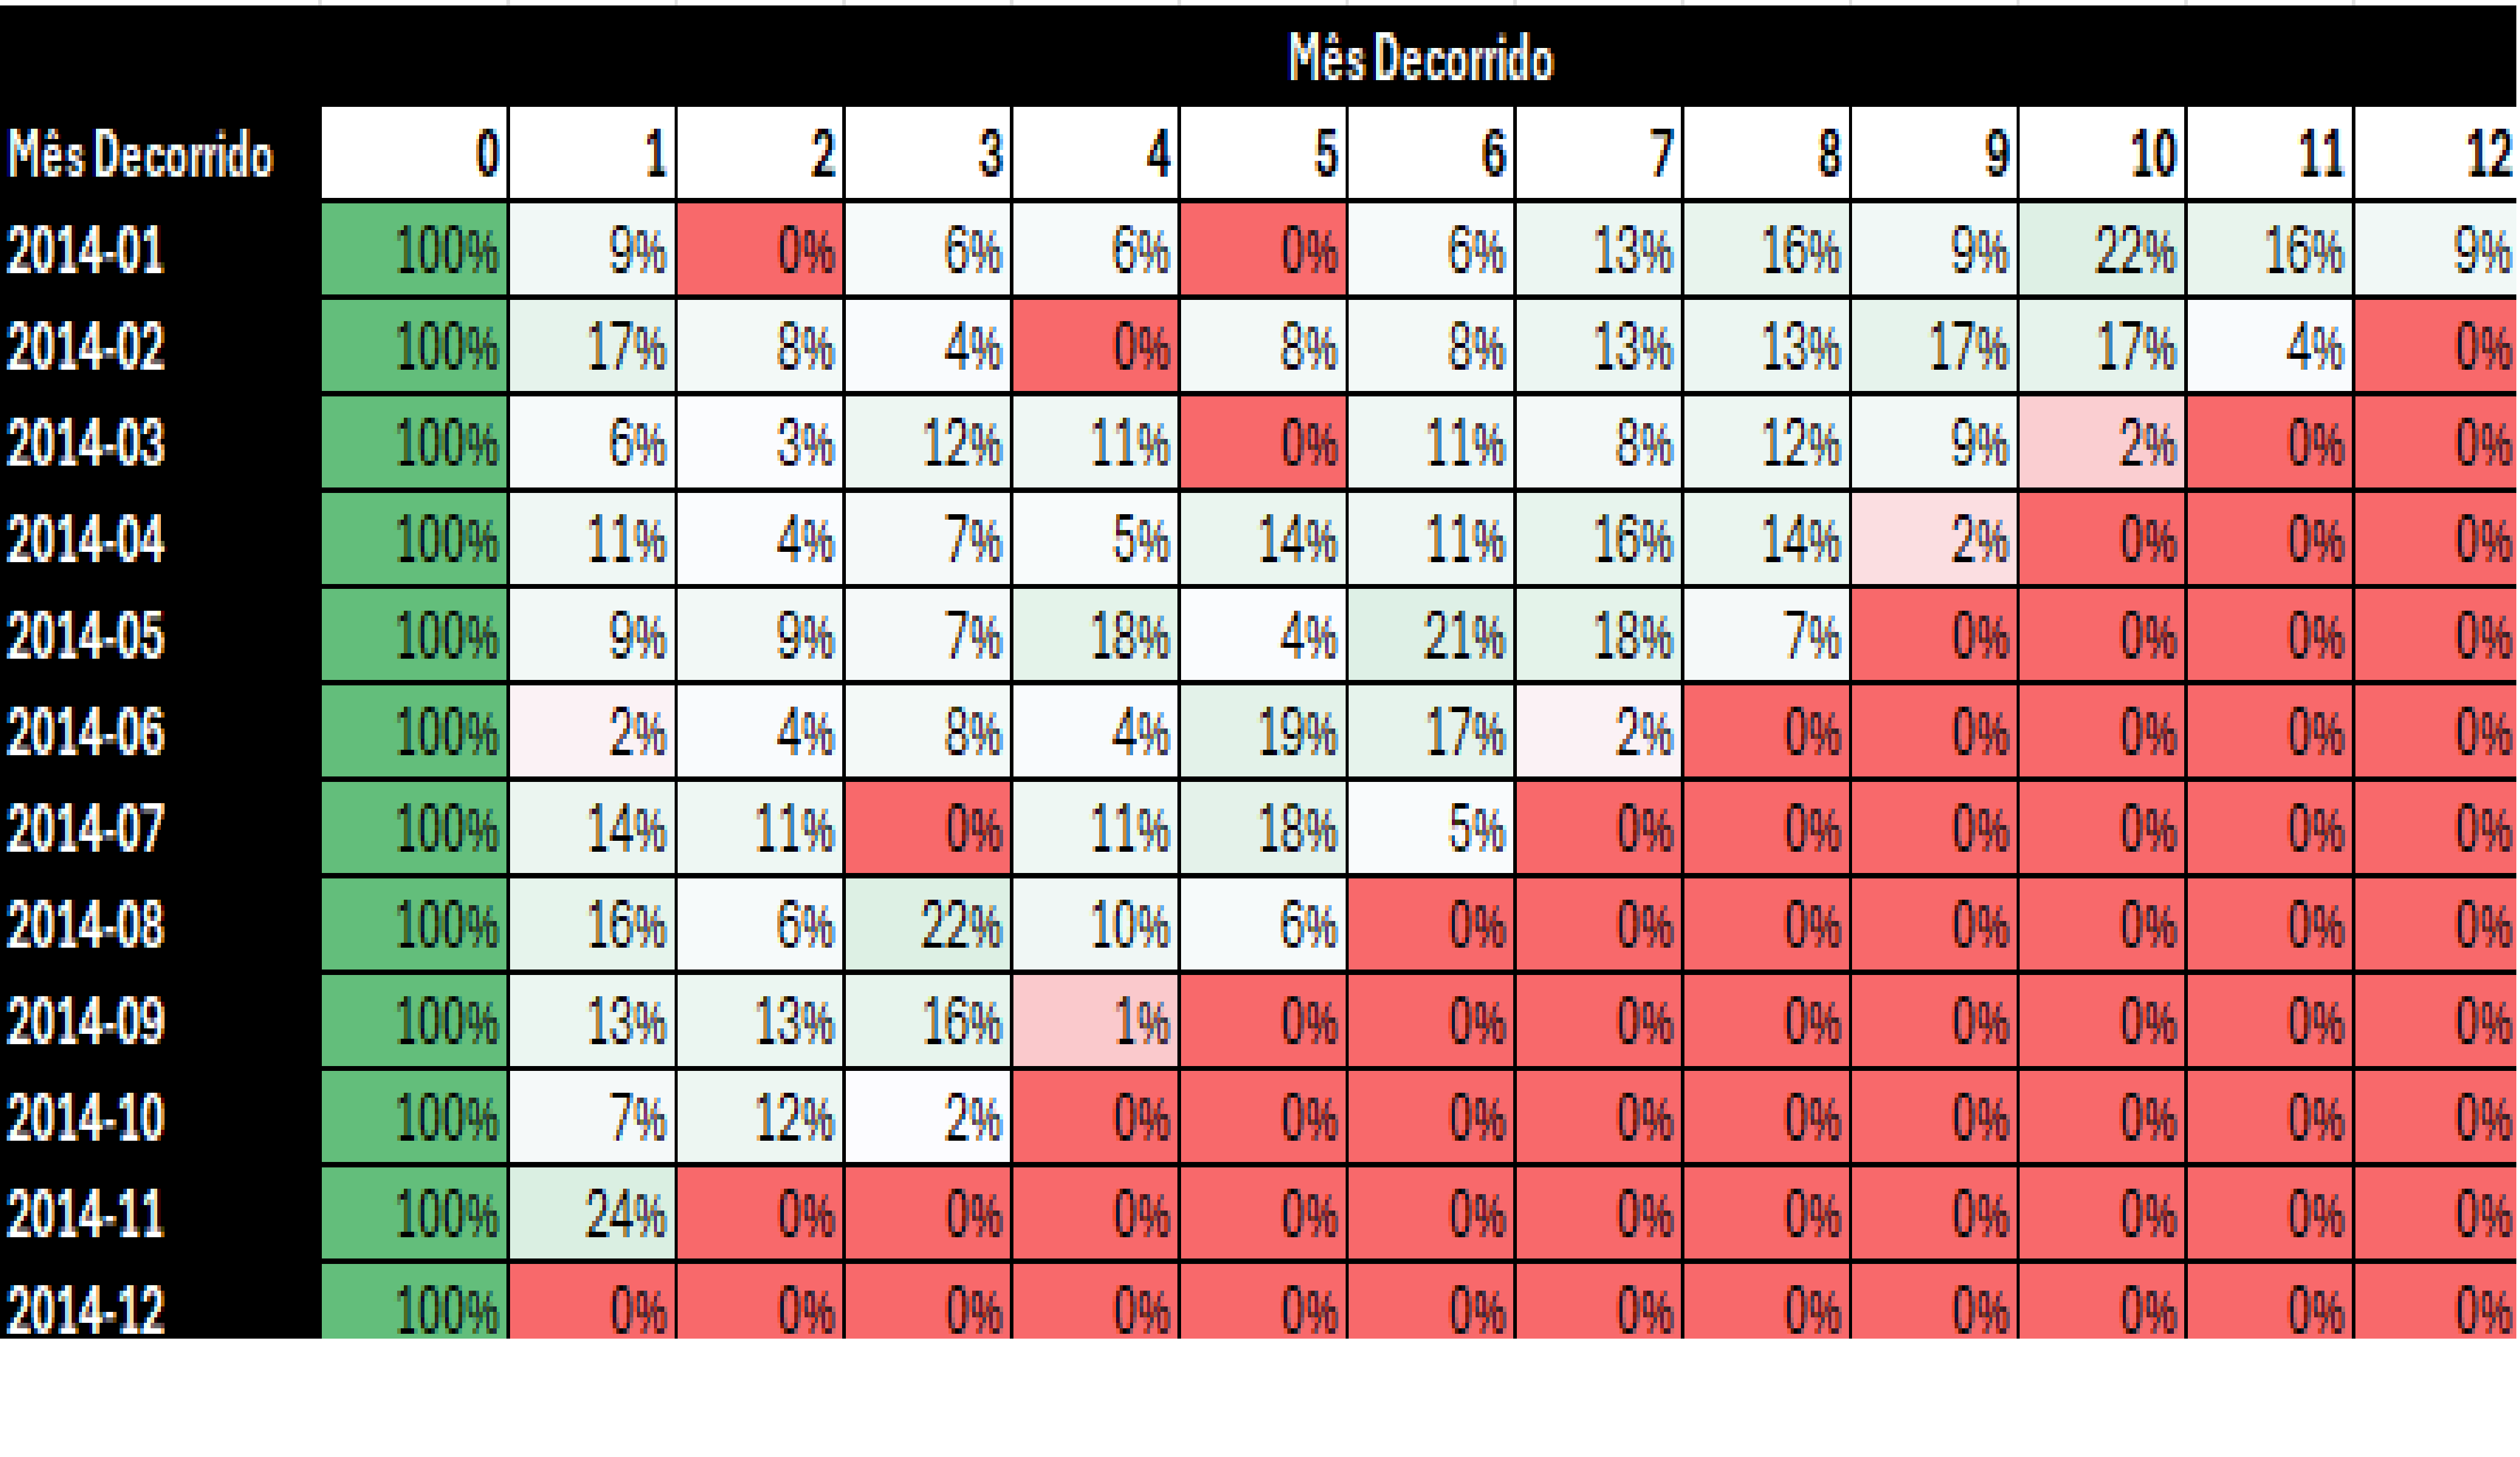
Cohort Analysis – SuperStore
Using Excel, I developed a customer retention cohort analysis with real data from a national supermarket chain. Through data cleaning and structuring, I identified the best acquisition groups and behavior patterns, generating strategic insights for retention and sales.
- Tools: Excel, VLOOKUP, Pivot Tables, Conditional Formatting
- Result: May/2014 cohort had the highest retention after 6 months (11%)
- Key Insight: Promotional campaigns positively impact repurchase behavior
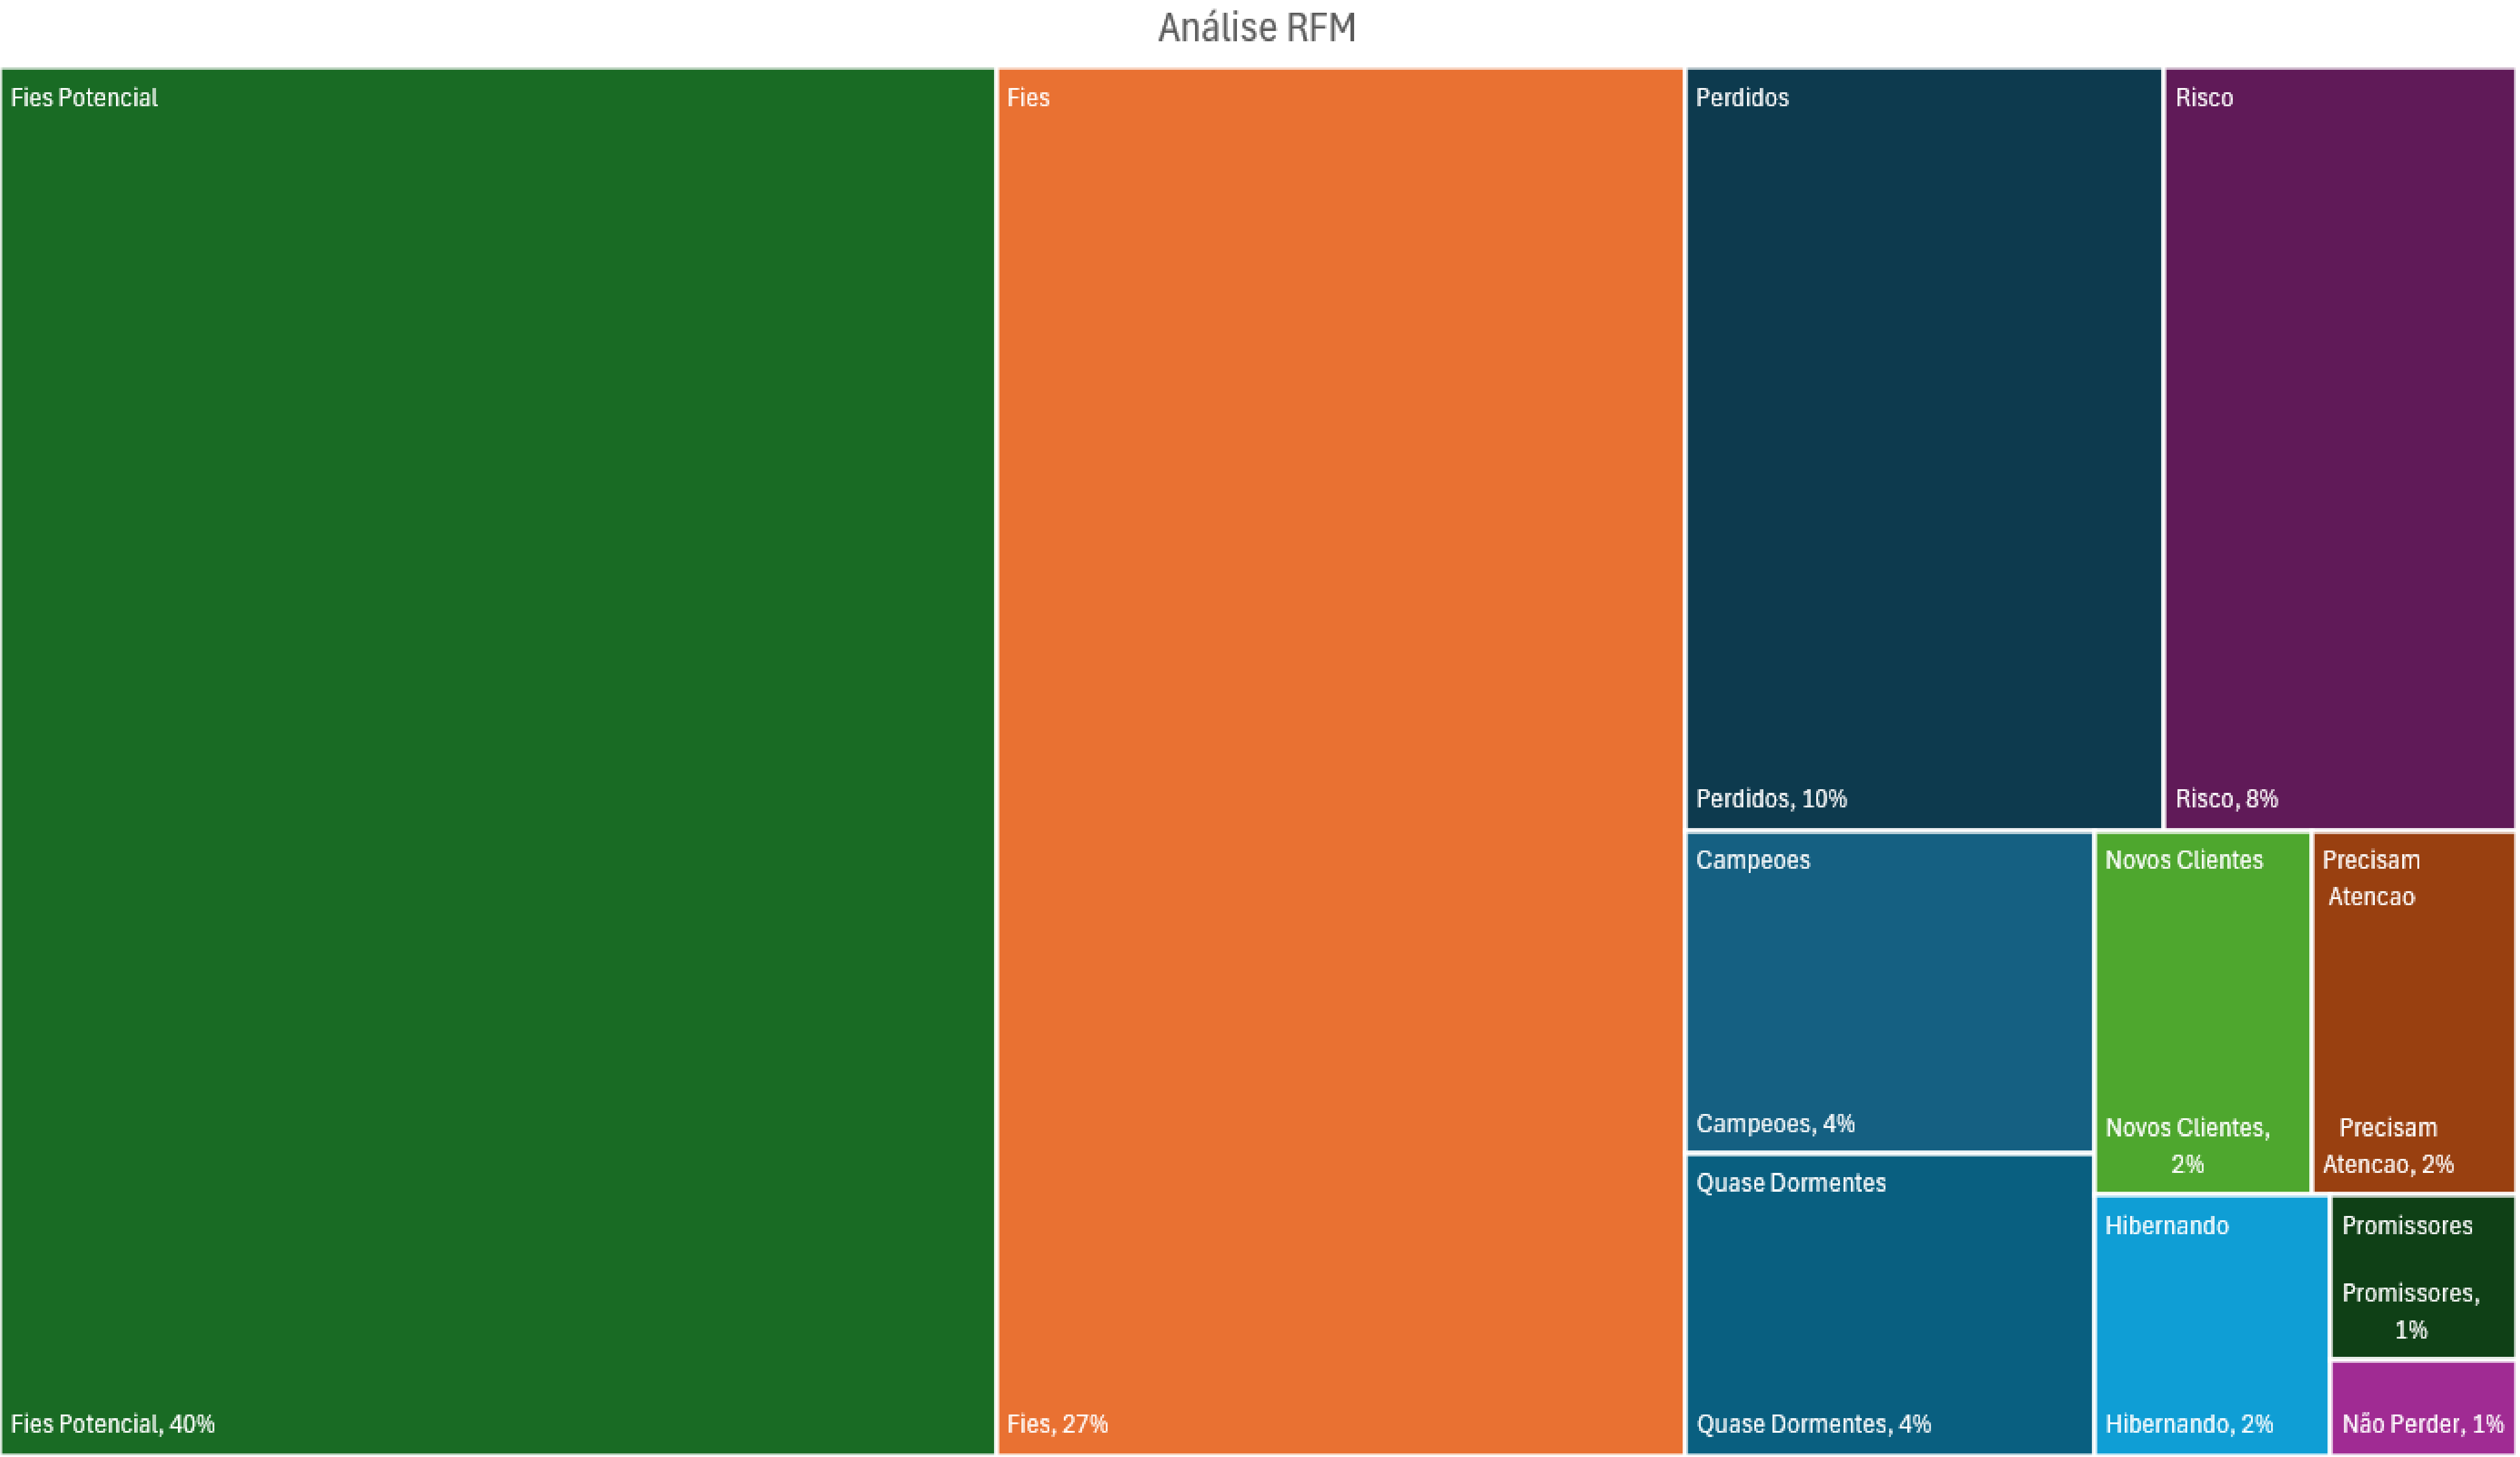
RFM Analysis – Customer Segmentation
I classified customers based on their purchasing behavior using the RFM technique (Recency, Frequency, and Monetary). This analysis enables segmentation of the customer base to create personalized campaigns and maximize marketing ROI.
- Tools: Excel (INDEX, MATCH, SUMIF, PERCENTILE)
- Segments Created: Champions, Loyal, Promising, Lost, and more
- Results: 40% of customers are potential loyal; only 1% in “Do Not Lose” group
DataLuz – SaaS Platform for E-commerce
I developed a fictional digital solution for small and medium-sized e-commerce businesses that struggle with data analysis. DataLuz offers intuitive dashboards, automated WhatsApp alerts, and customized reports. This project is part of the DS Community course and includes the full creation of a digital business model using AARRR strategies.
- Tools: Product Strategy, AARRR Metrics, Customer Journey
- Problem: Lack of time and technical knowledge for BI
- Solution: API integration, automated reports, and simplified visualization
- Highlight: Insights sent directly to the entrepreneur's WhatsApp
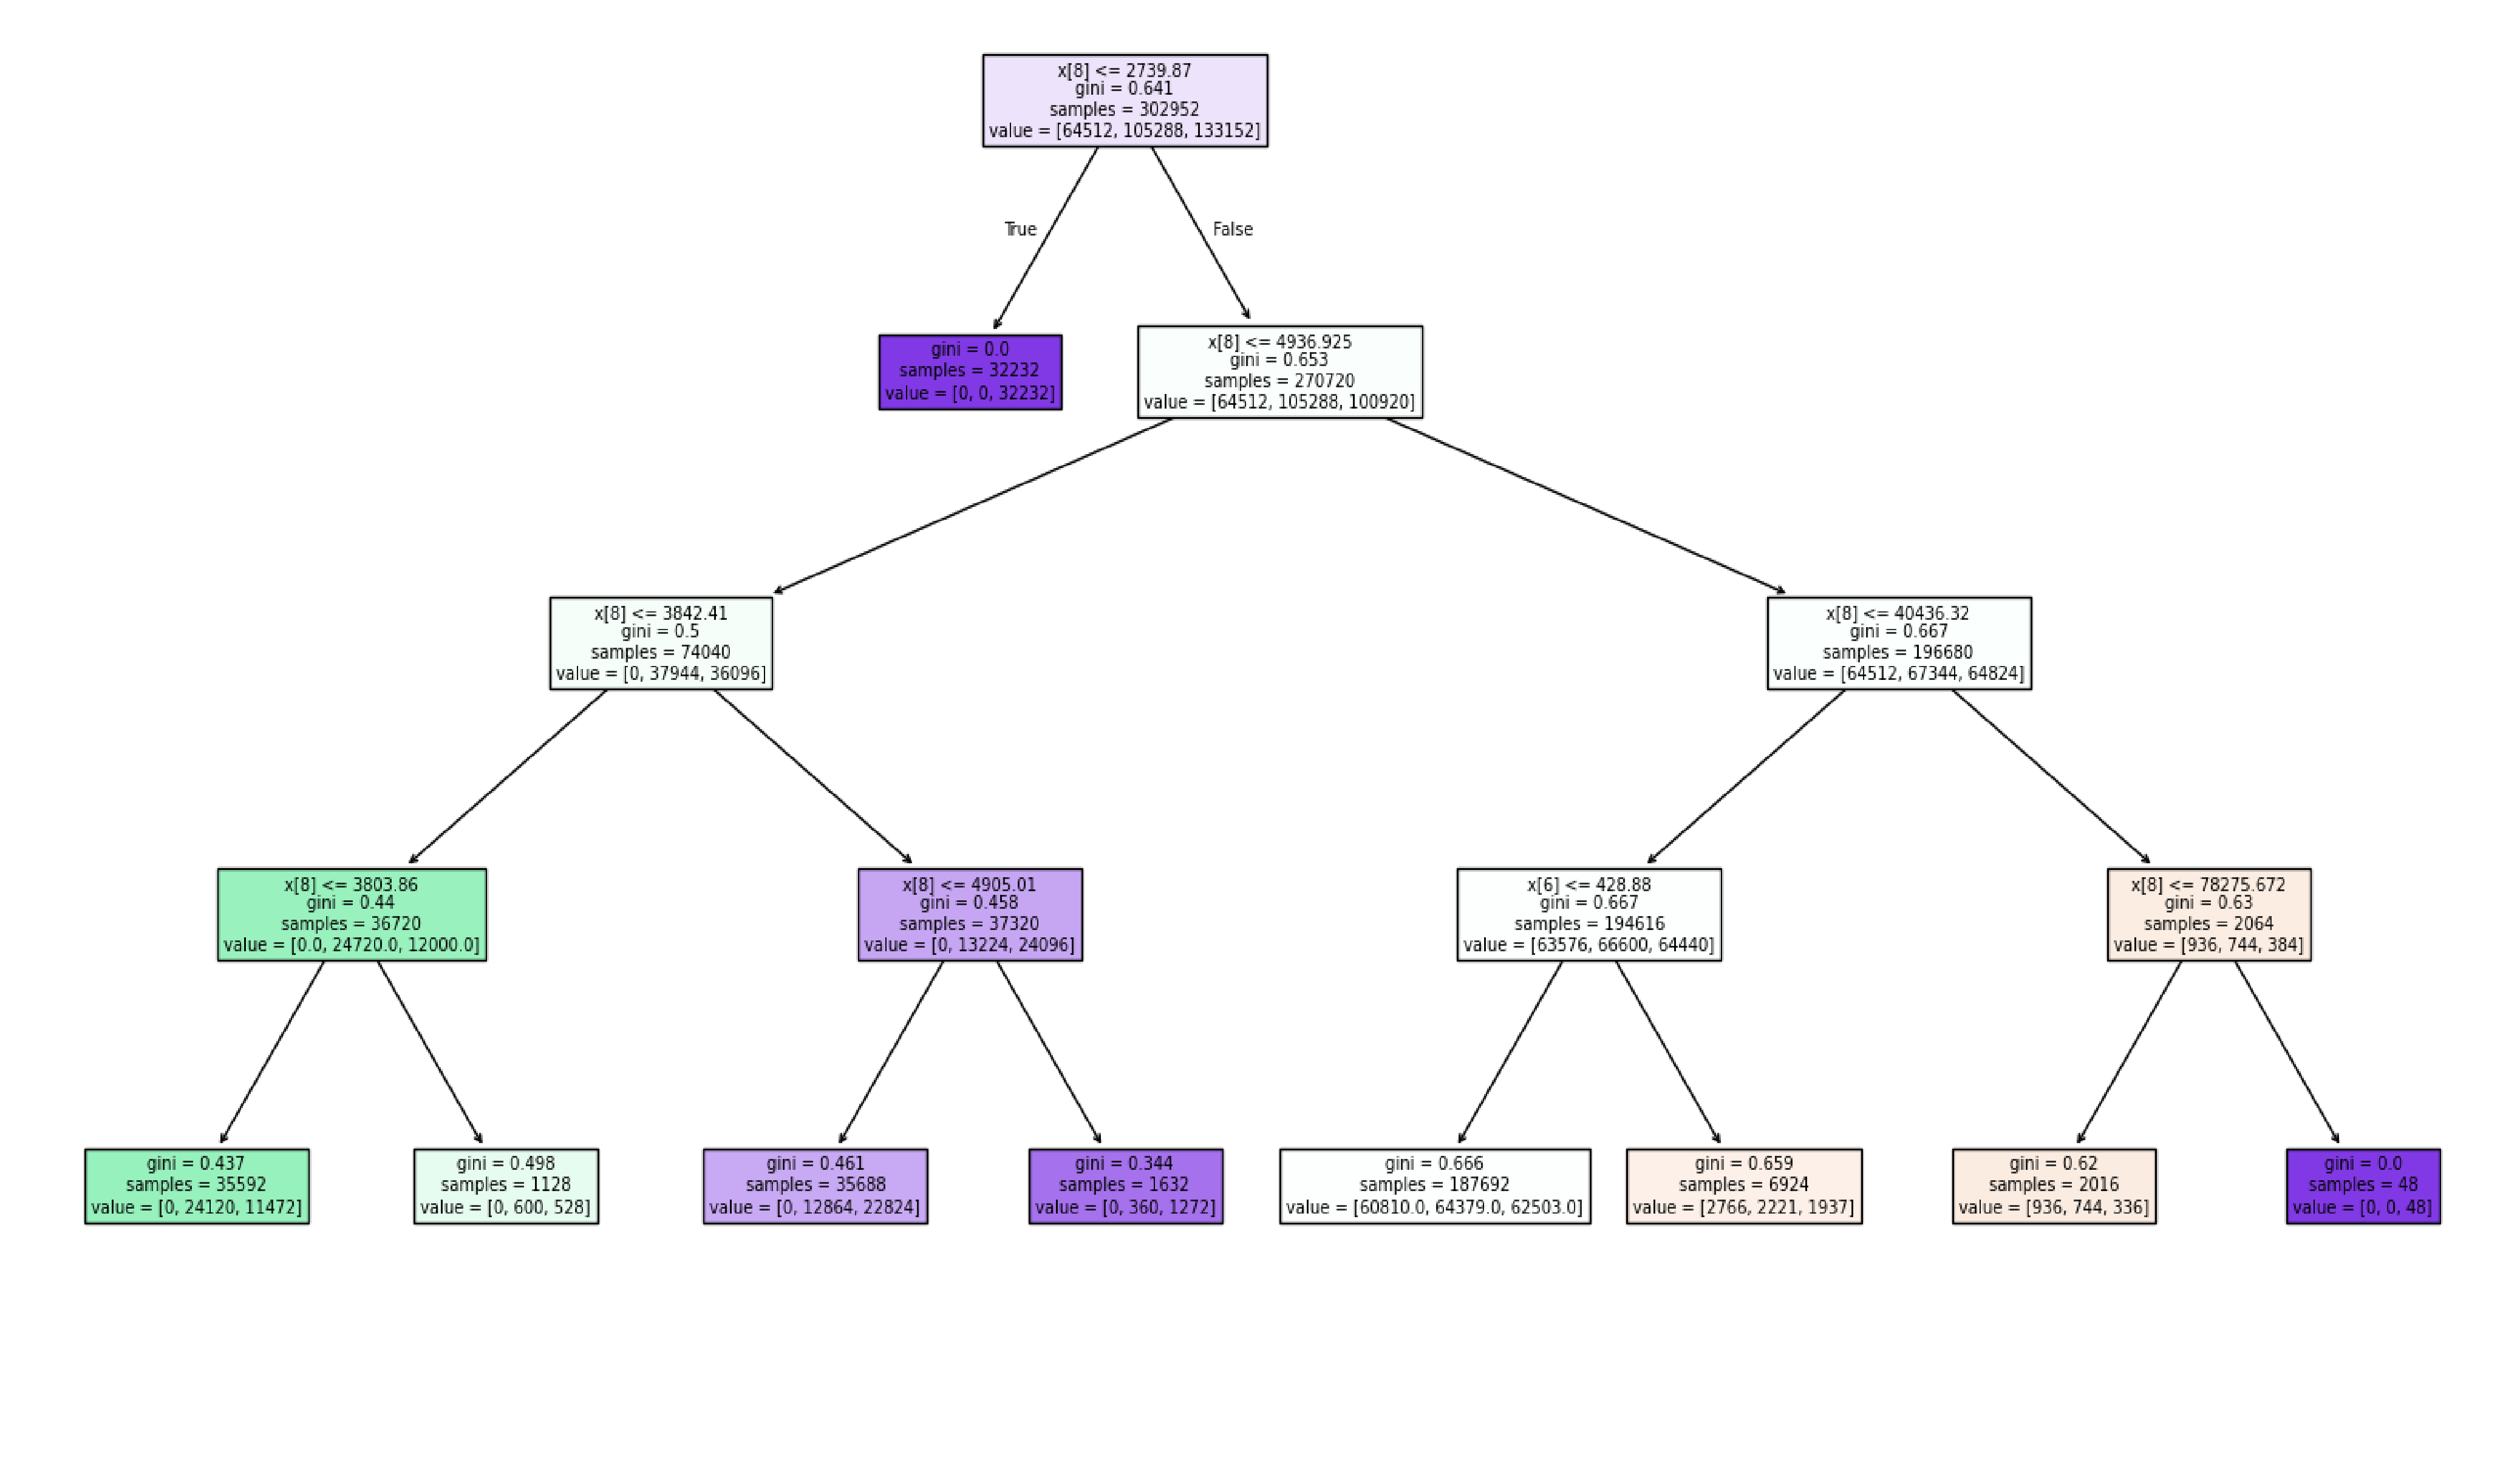
Loyalty Prediction with AI – Customer Classification
In this project, I developed a Machine Learning model using Decision Tree to predict the likelihood of customers signing up for loyalty cards (Aurora, Nova, and Star). The interface was built with Gradio, allowing anyone to simulate the classification of a new customer intuitively. Perfect for marketing and retention applications.
- Tools: Python, Pandas, Scikit-Learn, Gradio, Matplotlib
- Problem: Companies couldn't predict customer likelihood to join loyalty programs
- Solution: Decision tree classification + interactive Gradio interface
- Highlight: Interactive deployment with real-time tree visualization

Legal Data Simulation with Synthetic Data for Data Science
I created a realistic synthetic legal data generator, producing a complete dataset with 2,000 cases, parties involved, and procedural movements. This solution is ideal to showcase skills in data analysis, BI, and predictive modeling in a scenario that mirrors the real legal world.
- Tools: Python, Pandas, Faker
- Problem: Difficulty obtaining detailed legal data due to confidentiality
- Solution: A script that generates a robust, realistic dataset in .csv format, ready for use in Power BI, Excel, or Python
- Highlight: Ability to simulate a complex environment including claim values, risk provisions, legal stages, and responsible lawyers
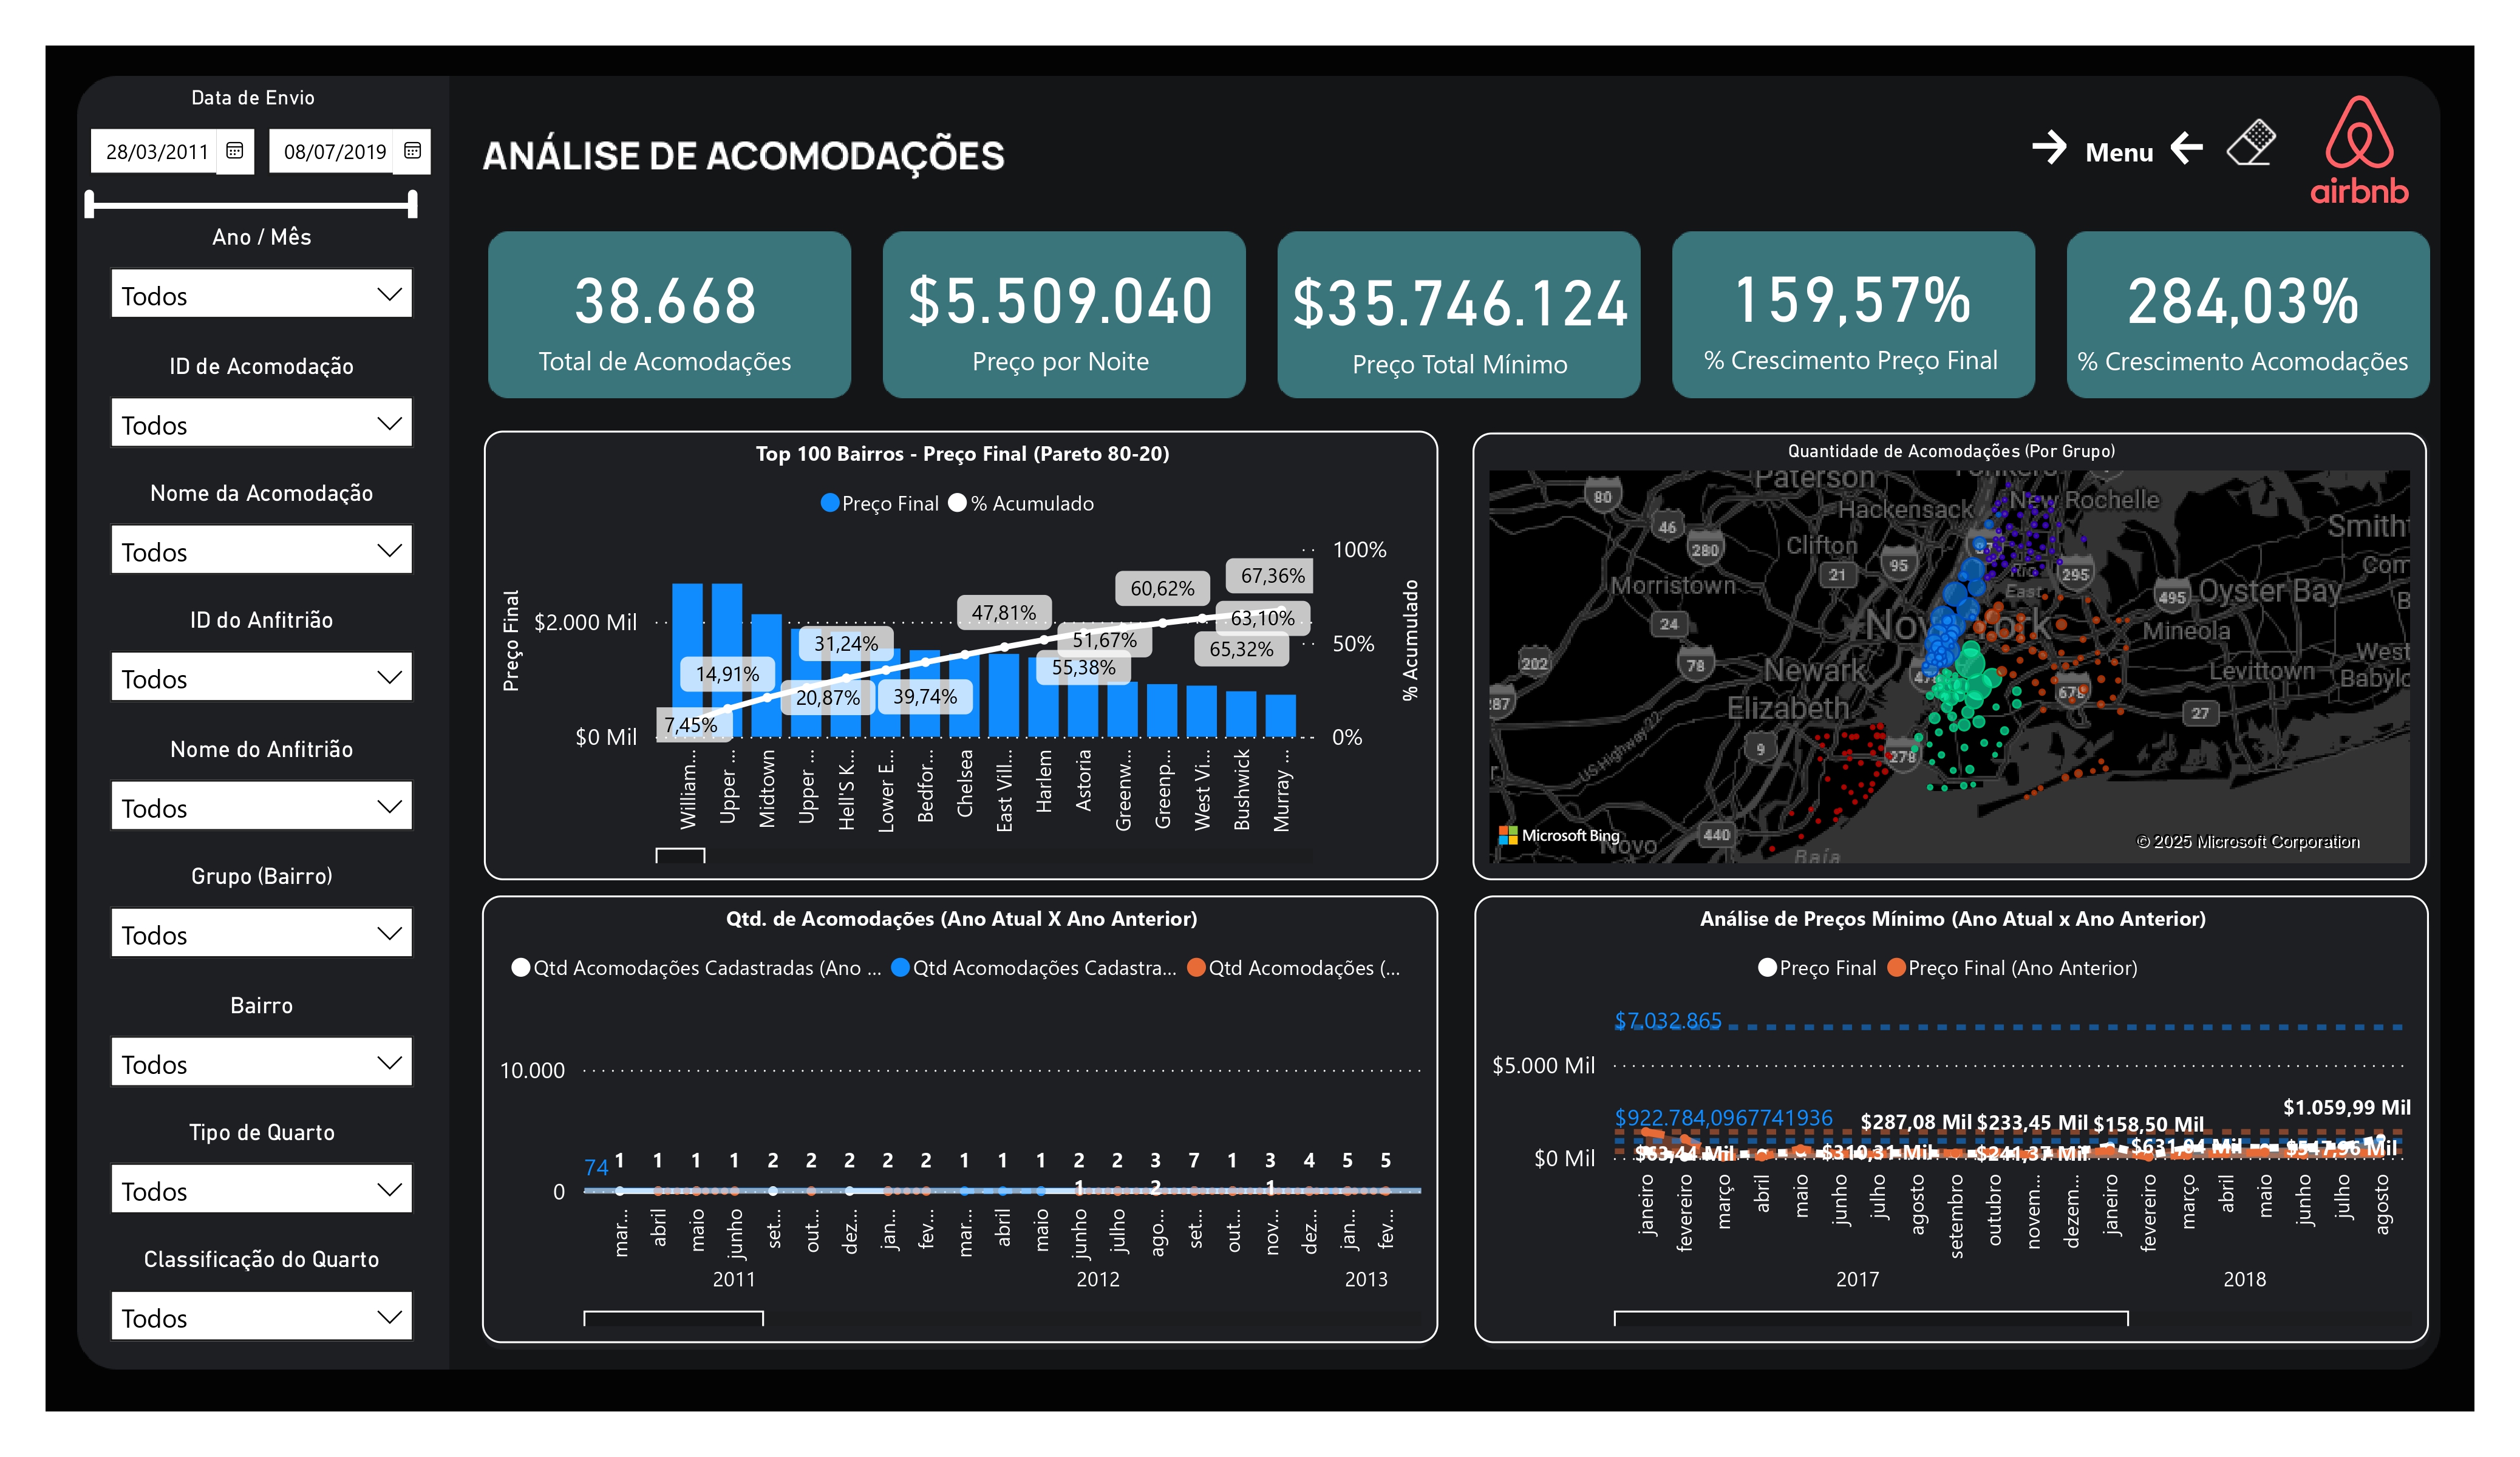
Accommodation and Pricing Analysis – Airbnb NYC
A full Data Analysis project using a large Airbnb dataset from New York City. The goal was to turn thousands of records into strategic insights about accommodations, pricing, and location patterns through a dynamic and visually intuitive Power BI dashboard.
- Tools: Power BI, Power Query, DAX
- Highlights: Pareto chart (Top 100 neighborhoods), geographic map, time analysis, and performance indicators (KPIs)
- Key Insight: Identification of neighborhoods with the highest concentration of premium listings and seasonal price patterns


